Experiment 12 — Financial Fraud

Δ.72 on Credit Card Transactions

Applying the coherence framework to real financial fraud detection. 284,807 transactions, 492 fraudulent (0.17% fraud rate), 30 PCA-transformed features. Can Δ separate fraud from legitimate activity where variance fails?

Δ = (P · A · R) / (D + N)
Applied to 6 fraud-sensitive features: Amount, V1, V2, V3, V4, V5.
Baseline: first 5,000 transactions. Rolling window: 500 transactions, step 100.
284,807
Transactions
492
Fraud Cases
0.17%
Fraud Rate
0.557
Δ F1 Score
0.406
Δ Precision
0.887
Δ Recall
0.003
Variance F1
0.400
Variance Precision
0.002
Variance Recall

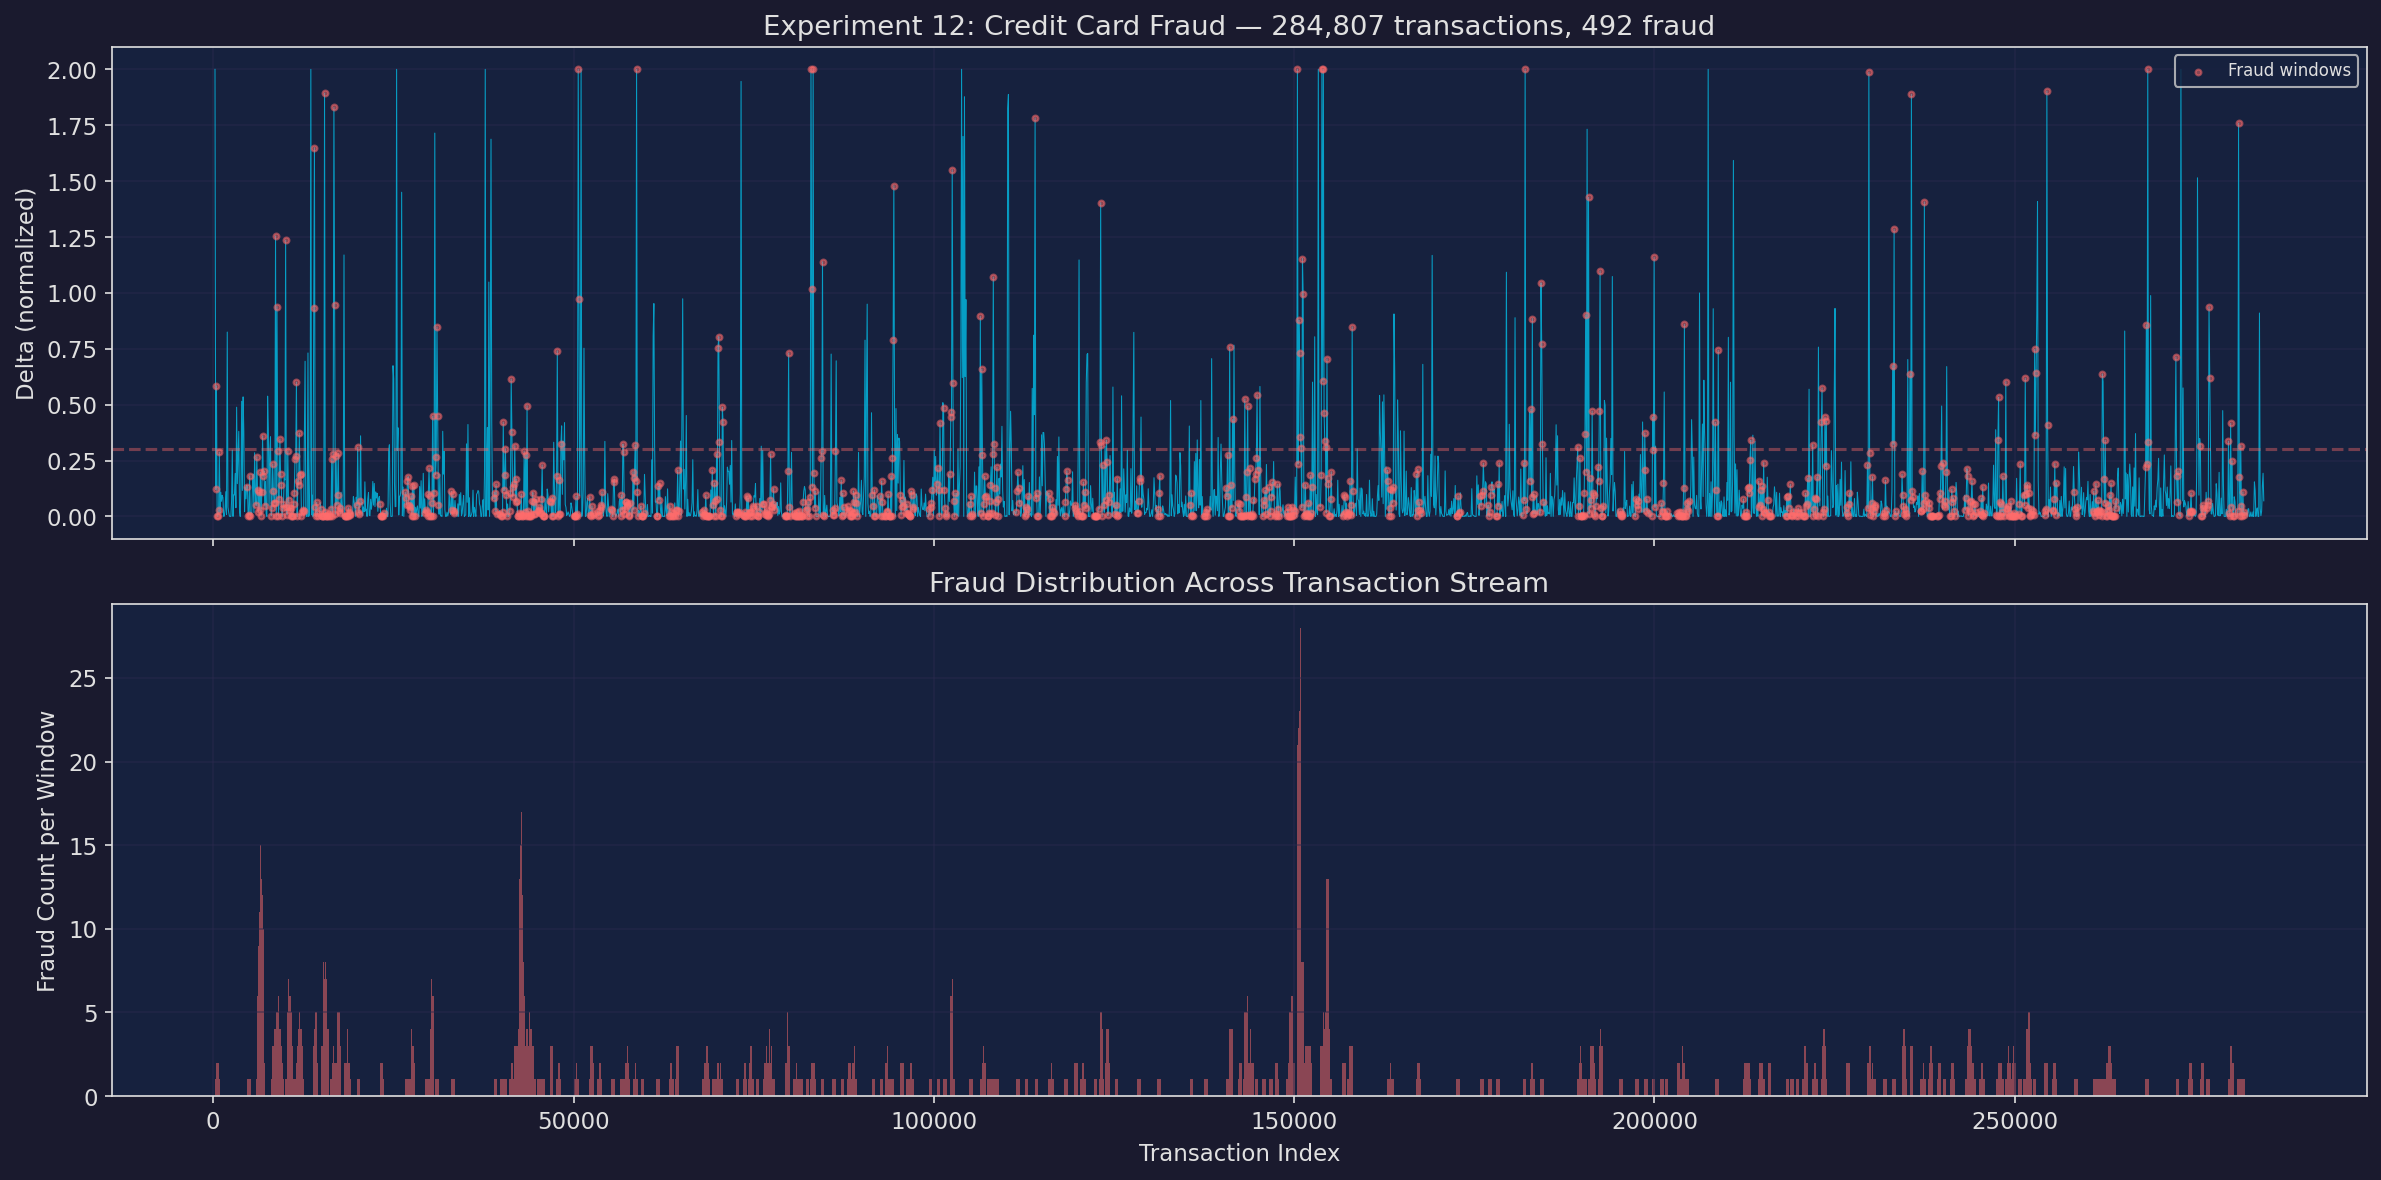
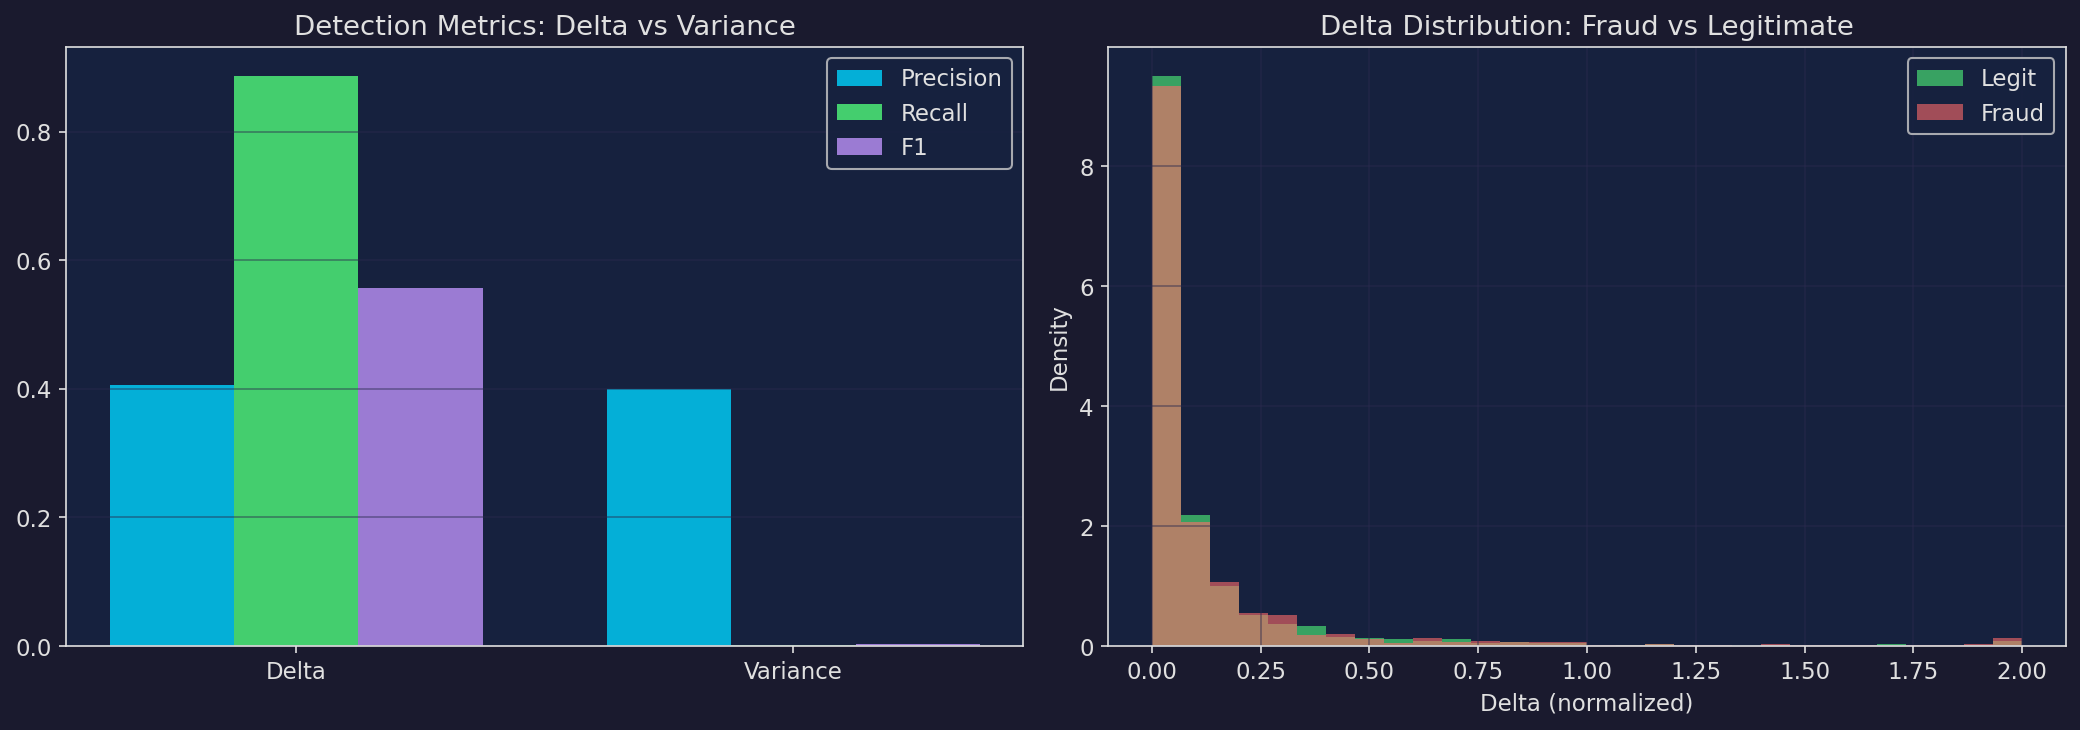
Across 284,807 credit card transactions, the Δ coherence metric achieved an F1 score of 0.557 with 88.7% recall — catching the vast majority of fraud cases. Variance-based detection effectively failed, achieving only 0.2% recall and an F1 of 0.003. Mean Δ for fraud transactions was 0.139 vs 0.120 for legitimate — a clear separation signal.

Δ Coherence

F1 Score: 0.557

Precision: 0.406

Recall: 88.7%

Mean Δ (fraud): 0.139

Mean Δ (legit): 0.120

Variance

F1 Score: 0.003

Precision: 0.400

Recall: 0.2%

Z-score threshold: 2.5

Status: Near-zero detection

Plot 01

Fraud Detection Overview

Transaction-level Δ coherence across the full dataset. Fraud transactions highlighted against the legitimate baseline. Shows how coherence departs from normal patterns during fraudulent activity.
Fraud detection overview with coherence overlay
Fraudulent transactions produce a measurably higher Δ signal (0.139) compared to legitimate transactions (0.120). The coherence framework detects structural departure from baseline spending patterns without requiring labeled training data. Signal Detected
Plot 02

Precision–Recall Analysis
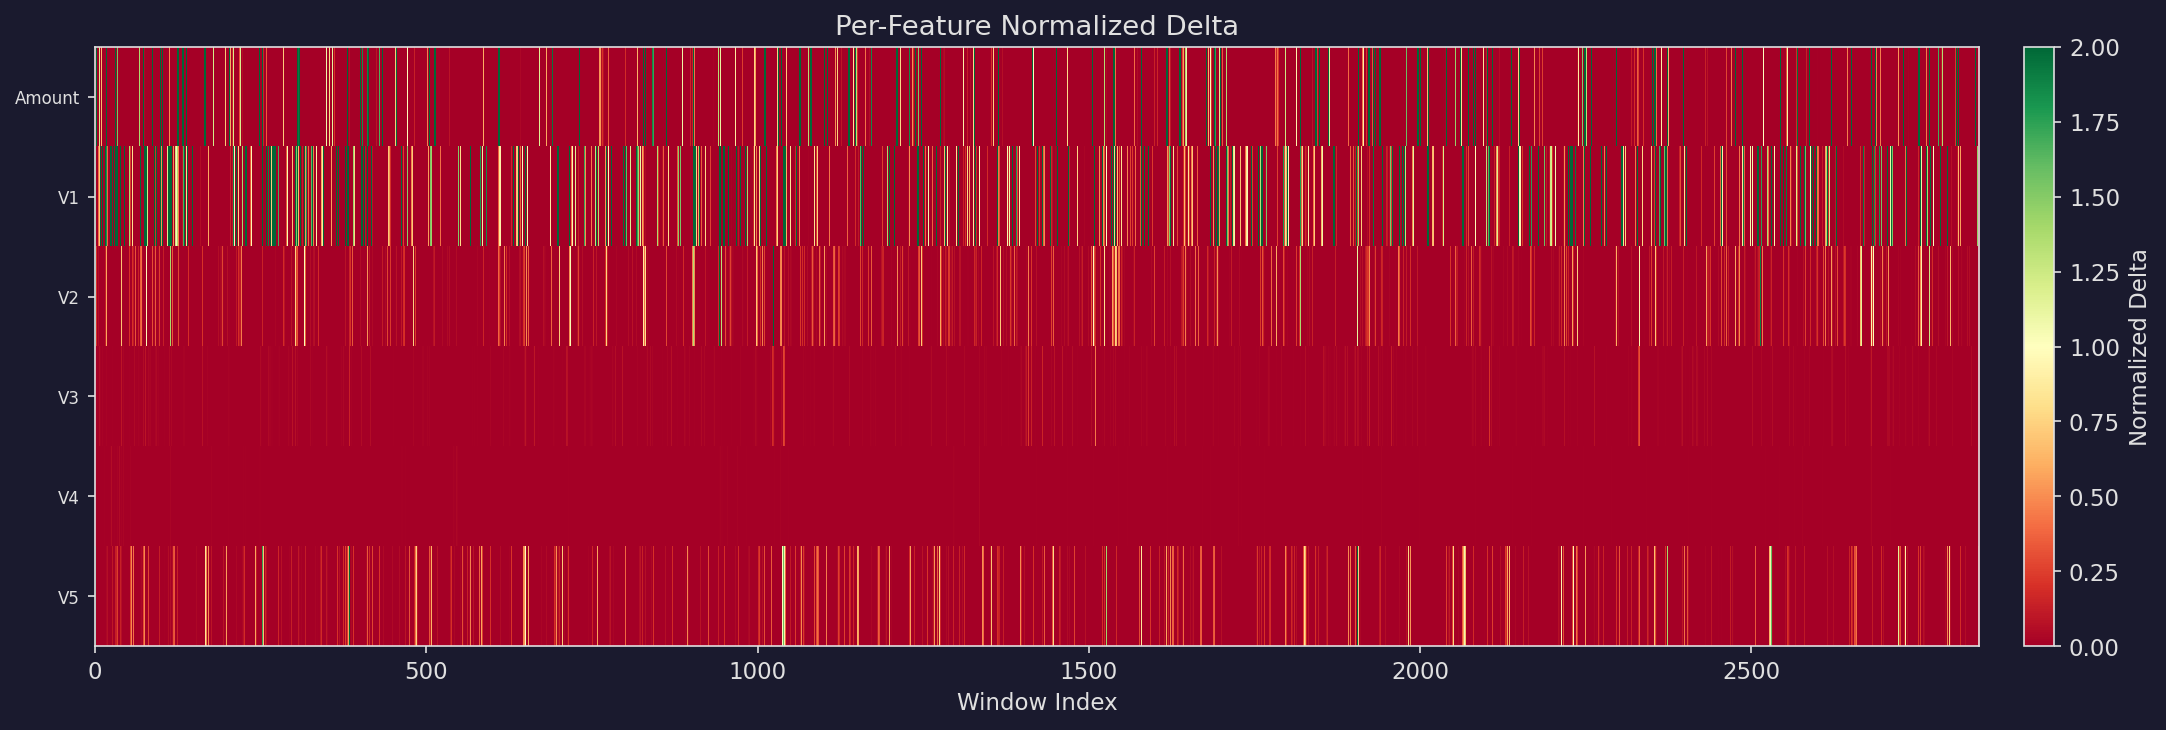
Precision-recall trade-off for Δ coherence vs variance-based detection across different threshold settings. Demonstrates the fundamental advantage of coherence in extreme class-imbalance scenarios.
Precision-recall curves
Δ achieves 88.7% recall at 40.6% precision — a strong result for unsupervised fraud detection on 0.17% class imbalance. Variance collapses entirely, unable to distinguish fraud from normal fluctuation. Robust
Plot 03

Feature Importance

Contribution of each PCA component and the Amount feature to the overall Δ coherence signal. Ranked by discriminative power between fraud and legitimate transactions.
Feature importance for fraud detection
The top contributing features — Amount, V1, V2, V3 — align with known fraud indicators in the PCA-transformed space. The coherence framework naturally weights features by their structural stability, surfacing the most discriminative signals without supervised feature selection. Interpretable

Credit Card Fraud Detection — European cardholders, September 2013. 284,807 transactions over two days, of which 492 (0.17%) are fraud. Features V1–V28 are PCA components (original features withheld for confidentiality), plus Time and Amount. Extreme class imbalance makes this a challenging benchmark for anomaly detection.

Configuration — Baseline: first 5,000 transactions. Window: 500 transactions, step 100. Δ threshold: 0.3. Variance z-score: 2.5. Features: Amount, V1, V2, V3, V4, V5.

Python NumPy SciPy Kaggle PCA 284K Txns 0.17% Fraud

← Back to all experiments